Define CRT and Refresh CRT?
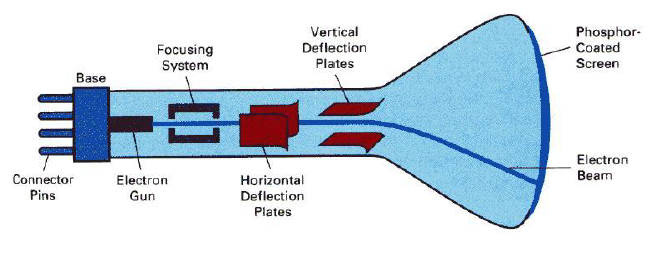
CRT stands for Cathode Ray Tube. CRT is a technology used in traditional computer monitors and televisions. The image on CRT display is created by firing electrons from the back of the tube of phosphorus located towards the front of the screen.
Once the electron heats the phosphorus, they light up, and they are projected on a screen. The color you view on the screen is produced by a blend of red, blue and green light.
Cathode ray tube image Components of Cathode Ray Tube
Some of the main Components of cathode ray tube is:
Electron Gun:
Electron gun consisting of a series of elements, primarily a heating filament (heater) and a cathode. The electron gun creates a source of electrons which are focused into a narrow beam directed at the face of the CRT.
Control grid: It is used to turn the electron beam on and off.
Focusing anode: It is used to create a clear picture by focusing the electrons into a narrow beam.
Deflection anodes:
It deflects the electron beam there are two types of this anode one handles the horizontal deflection and other handles the vertical deflection.
These two anodes are placed perpendicular to each other and they deflect the electron beam towards the position in a phosphorus screen.
Phosphorus-coated screen:
The inside front surface of every CRT is coated with phosphors. Phosphors glow when a high-energy electron beam hits them. Phosphorescence is the term used to characterize the light given off by a phosphor after it has been exposed to an electron beam.
What is DDA line drawing algorithm?
DDA (Digital Differential Analyzer) is a line drawing algorithm used in computer graphics to generate a line segment between two specified endpoints. It is a simple and efficient algorithm that works by using the incremental difference between the x-coordinates and y-coordinates of the two endpoints to plot the line.
The steps involved in DDA line generation algorithm are:
1.Input the two endpoints of the line segment, (x1,y1) and (x2,y2).
2.Calculate the difference between the x-coordinates and y-coordinates of the endpoints as dx and dy respectively.
3.Calculate the slope of the line as m = dy/dx.
4.Set the initial point of the line as (x1,y1).
5.Loop through the x-coordinates of the line, incrementing by one each time, and calculate the corresponding y-coordinate using the equation y = y1 + m(x – x1).
6.Plot the pixel at the calculated (x,y) coordinate.
7.Repeat steps 5 and 6 until the endpoint (x2,y2) is reached.
DDA algorithm is relatively easy to implement and is computationally efficient, making it suitable for real-time applications. However, it has some limitations, such as the inability to handle vertical lines and the need for floating-point arithmetic, which can be slow on some systems. Nonetheless, it remains a popular choice for generating lines in computer graphics.
What is Bresenham Line drawing algorithm?
This algorithm is used for scan converting a line. It was developed by Bresenham. It is an efficient method because it involves only integer addition, subtractions, and multiplication operations. These operations can be performed very rapidly so lines can be generated quickly.
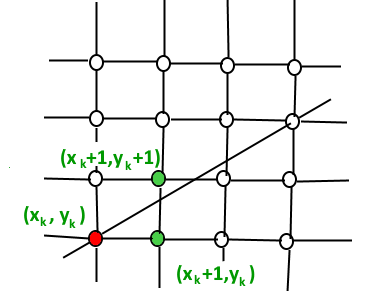
In this method, next pixel selected is that one who has the least distance from true line
Graph image Algorithm:
The main condition is to first check :
if(pk< 0):
{
plot(xk+1,yk);
pk+1 = pk+ 2Δy;
}
else
{
plot(xk+1,yk+1);
pk+1 = pk + 2Δy - 2Δx;
}
What is Bresenham Circle drawing algorithm?
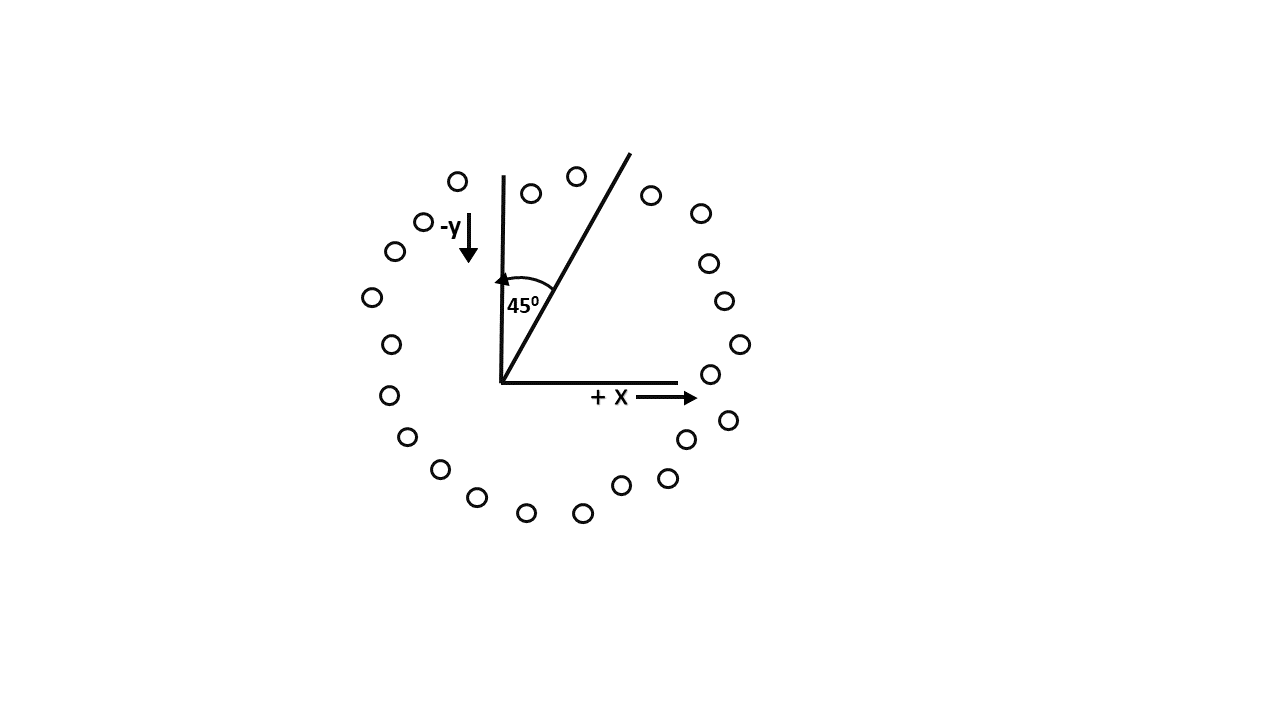
Scan-Converting a circle using Bresenham's algorithm works as follows: Points are generated from 90° to 45°, moves will be made only in the +x & -y directions as shown in Image:
90° to 45°. Assume that the last scan-converted pixel is P1 as shown in fig. Each new point closest to the true circle can be found by taking either of two actions.
Move in the x-direction one unit or
Move in the x- direction one unit & move in the negative y-direction one unit.
Let D (Si) is the distance from the origin to the true circle squared minus the distance to point P3 squared. D (Ti) is the distance from the origin to the true circle squared minus the distance to point P2 squared.
Algorithm
The main condition is to first check:
if(p< 0)
{
x = x+1;
p = p +2x+1;
}
else
{
x = x+1;
y = y-1;
p = p + 2x - 2y +1;
}
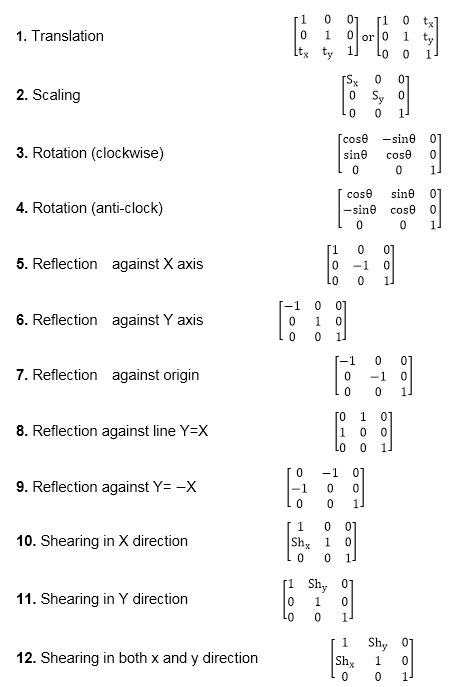
What are the Homogeneous transformation matrix for 2dimensional?
First of all what are the Homogeneous coordinates:
Rotation:
The rotation of a point, straight line or an entire image on the screen, about a point other than origin, is achieved by first moving the image until the point of rotation occupies the origin, then performing rotation, then finally moving the image to its original position.
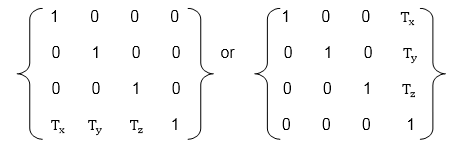
Translation
The moving of an image from one place to another in a straight line is called a translation. A translation may be done by adding or subtracting to each point, the amount, by which picture is required to be shifted.
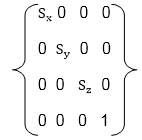
Scaling
It is used to alter or change the size of objects. The change is done using scaling factors. There are two scaling factors, i.e. Sx in x direction Sy in y-direction. If the original position is x and y. Scaling factors are Sx and Sy then the value of coordinates after scaling will be x1 and y1.
Matrix image
Define Interactive Picture Construction Technique?
Interactive picture- construction methods are commonly used in variety of applications, including design and painting packages. These methods provide
user with the capability to position objects, to constrain to predefined orientations or alignments, to
sketch and to drag objects around the screen.
The several techniques used for interactive
picture construction that are incorporated into graphics packages are:
Basic Pointing Methods:
coordinate values supplied by locator input are often used with positioning methods to specify a location for displaying an object or a character string.
Coordinate positions are selected interactively with a pointing device, usually by positioning the screen cursor.
Constraints
A constraint is a rule for altering input coordinates values to produce a specified orientation or alignment of the displayed coordinates. the most common constraint is a horizontal or vertical alignment of straight lines.
Grids
Another kind of constraint is a grid of rectangular lines displayed in some part of the screen area.
When a grid is used, any input coordinate position is rounded to the nearest intersection of two grid lines
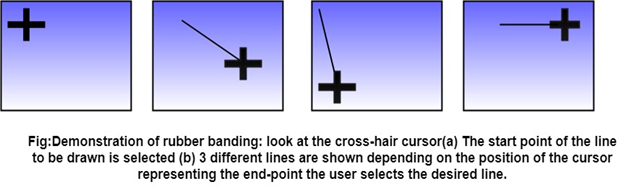
Rubber Band Methods
Straight lines can be constructed and positioned using rubber band methods which stretch out a line from a starting position as the screen cursor.
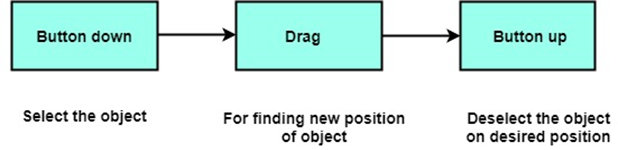
Rubber band methods image Dragging
This methods move object into position by dragging them with the screen cursor.
Dragging Image Painting & Drawing
Cursor drawing options can be provided using standard curve shapes such as circular arcs and splices, or with freehand sketching procedures.
Line widths, line styles and other attribute options are also commonly found in painting and drawing packages
Explain in detail about Translation,scaling and rotation in 3d transformation?
The geometric transformations play a vital role in generating images of three Dimensional objects with the help of these transformations.
Translation
It is the movement of an object from one position to another position. Translation is done using translation vectors. There are three vectors in 3D instead of two. These vectors are in x, y, and z directions.
Translation in the x-direction is represented using Tx.
The translation is y-direction is represented using Ty.
The translation in the z- direction is represented using Tz.
Matrix for translation Scaling
Scaling is used to change the size of an object. The size can be increased or decreased. The scaling three factors are required Sx Sy and Sz.
Sx=Scaling factor in x- direction
Sy=Scaling factor in y-direction
Sz=Scaling factor in z-direction
Matix for scaling Rotation
It is moving of an object about an angle. Movement can be anticlockwise or clockwise. 3D rotation is complex as compared to the 2D rotation. For 2D we describe the angle of rotation, but for a 3D angle of rotation and axis of rotation are required. The axis can be either x or y or z.
Matrix for rotation
What is liang barsky line clipping algorithm?
The Liang-Barsky algorithm is a line clipping algorithm. This algorithm is more efficient than Cohen-Sutherland line clipping algorithm and can be extended to 3-Dimensional clipping.
This algorithm is considered to be the faster parametric line-clipping algorithm. The following concepts are used in this clipping:
1.The parametric equation of the line.
2.The inequalities describing the range of the clipping window which is used to determine the intersections between the line and the clip window.
The parametric equation of a line can be given by,
X = x1 + t(x2-x1)
Y = y1 + t(y2-y1)
where t is between 0 and 1.
The Condition for line clipping is:
xwmin <= x1 + t(x2-x1) <= xwmax
ywmin <= y1 + t(y2-y1) <= ywmax
The above 4 inequalities can be expressed as,
tpk <= qk
Where k = 1, 2, 3, 4 (correspond to the left, right, bottom, and top boundaries, respectively).
The p and q are defined as,
p1 = -(x2-x1), q1 = x1 - xwmin (Left Boundary)
p2 = (x2-x1), q2 = xwmax - x1 (Right Boundary)
p3 = -(y2-y1), q3 = y1 - ywmin (Bottom Boundary)
p4 = (y2-y1), q4 = ywmax - y1 (Top Boundary)
Example Image
What is window to viewport Transformation?
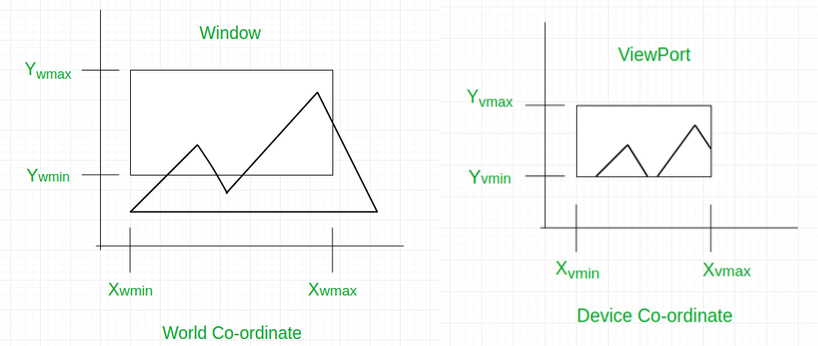
Window to Viewport Transformation is the process of transforming 2D world-coordinate objects to device coordinates. Objects inside the world or clipping window are mapped to the viewport which is the area on the screen where world coordinates are mapped to be displayed.
Example Image General Terms
General Terms:
World coordinate - It is the Cartesian coordinate w.r.t which we define the diagram, like Xwmin, Xwmax, Ywmin, Ywmax
Device Coordinate -It is the screen coordinate where the objects are to be displayed, like Xvmin, Xvmax, Yvmin, Yvmax
Window -It is the area on the world coordinate selected for display.
ViewPort -It is the area on the device coordinate where graphics is to be displayed.
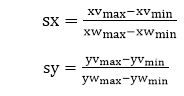
Scaling factors Image
What is cohan sultherland line clipping algorithm?
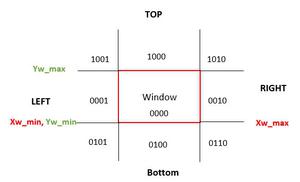
In this algorithm, we are given 9 regions on the screen. Out of which one region is of the window and the rest 8 regions are around it given by 4 digit binary. The division of the regions are based on (x_max, y_max) and (x_min, y_min).
The central part is the viewing region or window, all the lines which lie within this region are completely visible. A region code is always assigned to the endpoints of the given line.
Regions and code image
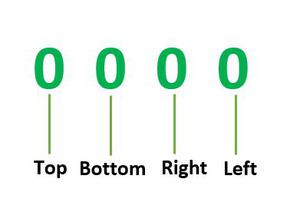
Formula to check binary digits:- TBRL which can be defined as top, bottom, right, and left accordingly.
TBLR Image
If the region code has all four 0 then it is completely inside.
And if it contains atleast one 1 then it is partially inside.
Lines Image
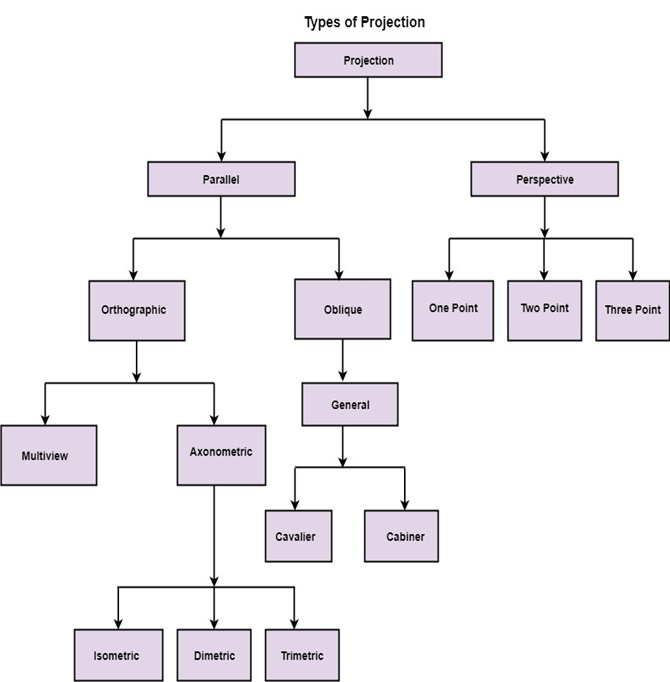
Explain about projections?
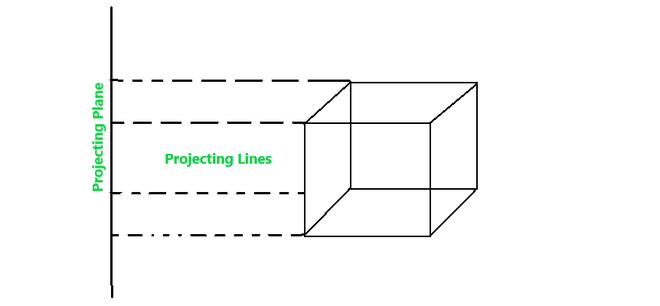
Projection is the process of placing a image or object on a plane or screen and the lines that transfer the image on the screen is called projection lines.
It is the process of converting a 3D object into a 2D object. It is also defined as mapping or transformation of the object in projection plane or view plane. The view plane is displayed surface.
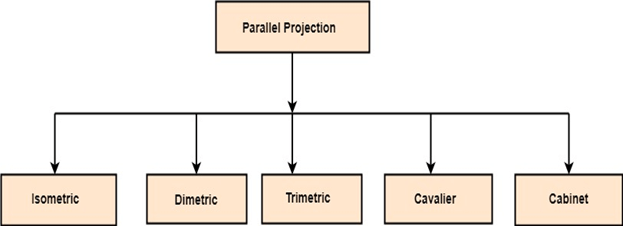
Types of projection Parallel Projection
Parallel Projection use to display picture in its true shape and size. When projection line are perpendicular to view plane then is called orthographic projection. The parallel projection is formed by extending parallel lines from each vertex on the object until they intersect the plane of the screen. The point of intersection is the projection of vertex.
Parallel projection image Types of Parllel projection
It is further divided into two types:
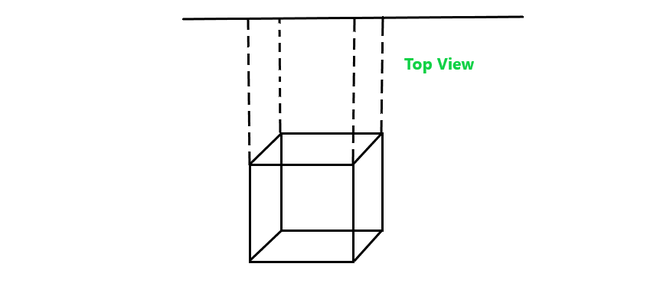
a) Orthographic parallel projection.
It is a kind of parallel projection where the projecting lines emerge parallelly from the object surface and incident perpendicularly at the projecting plane.
It is further divide into:
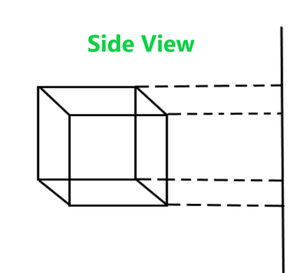
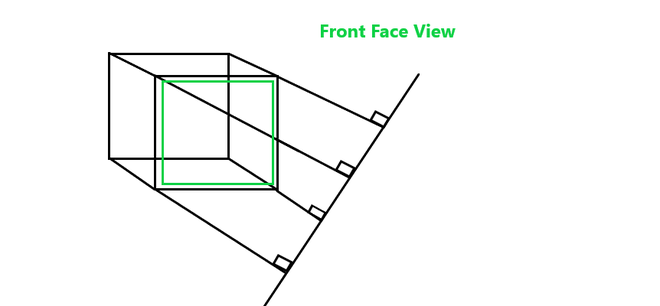
Multiview Top View Side view Front view Axonometric
Axonometric projection is an orthographic projection, where the projection lines are perpendicular to the plane of projection, and the object is rotated around one or more of its axes to show multiple sides.
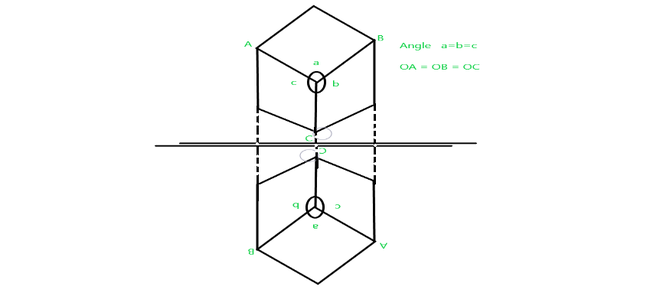
It is further divided into three categories:
Isometric all three sides are equal
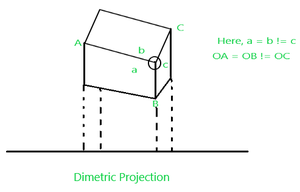
Dimetric any two sides are equal.
Trimetric no sides are equal
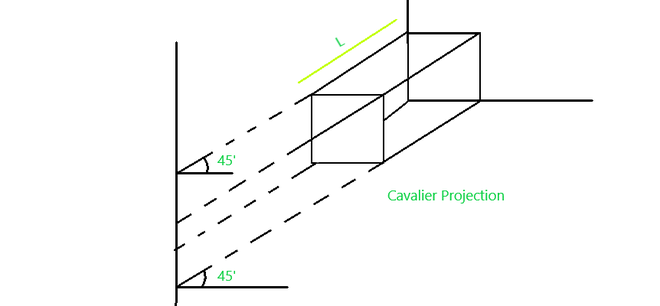
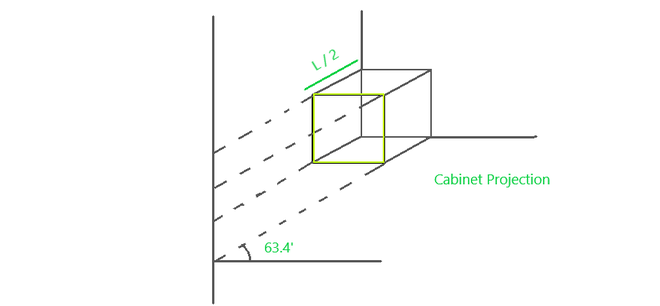
b)Oblique parallel projection
It is a kind of parallel projection where projecting rays emerges parallelly from the surface of the polygon and incident at an angle other than 90 degrees on the plane.
It is further divided into two types:
Cavalier Parallel projection where the angle it makes is 45deg.
Cabinet Parallel projection where the angle it makes is 63.4deg.
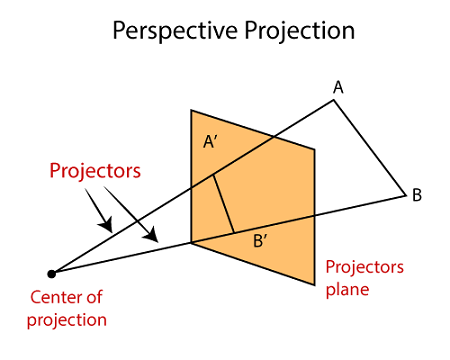
Persepective Projection
In perspective projection farther away object from the viewer, small it appears. This property of projection gives an idea about depth. The artist use perspective projection from drawing three-dimensional scenes.
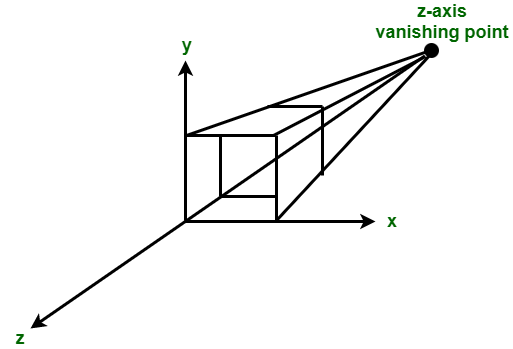
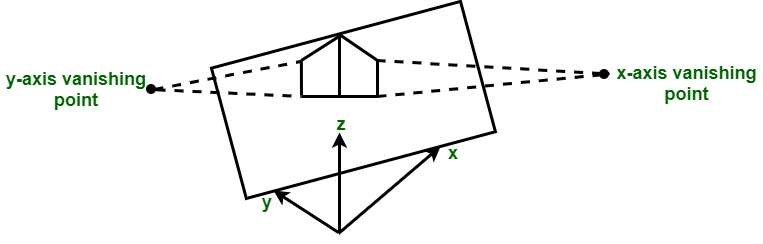
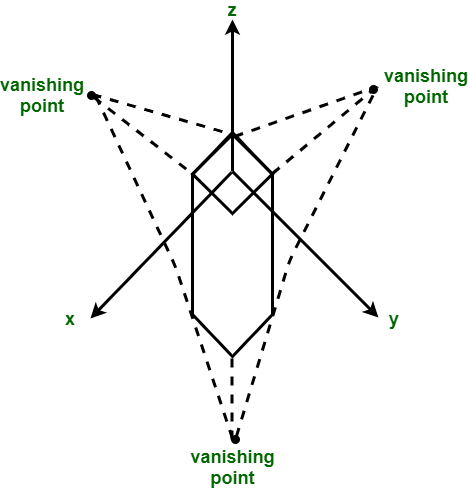
Two main characteristics of perspective are vanishing points and perspective foreshortening.
Perscpective projection Vanishing point
It is the point where all lines will appear to meet. There can be one point, two point, and three point perspectives.
Types of perspective projection One point perspective projection Two point Perscpective projecting Three point Perscpective projection
Enumerate the following
a) Line attributes.
b) Area fill attributes.
Line attributes
Line Type
line-type attribute -eg):solid lines, dashed lines, and dotted lines.
We modify a line drawing algorithm to generate such lines by setting the length and spacing of displayed solid sections along the line path.
A dashed line could be displayed by generating an interdash spacing that is equalto the length of the solid sections.
A dotted line can be displayed by generating very short dashes with the spacing equal to or greater than the dash size.
Line Size:
We set the line-width attribute with the command: Line-width parameter lr. is assigned a positive number to indicate the relative width of the line to be displayed.
Line Color
When a system provides color (or intensity) options, a parameter giving the current
Color index is included in the list of system-attribute values. A polyline routinedisplays a line in the current color by setting this color value in the framebuffer at pixel locations along the line path using the setpixel procedure.
Area Fill attributes
Options for filling a defined region include a choice
between a solid colour or a patterned fill and choices for the particular
colours and patterns.
These fill options can be applied to polygon regions
or to areas defined with curved boundaries, depending on the capabilities
of the available package.
In addition, areas can be painted using various
brush styles, colours, and transparency parameters
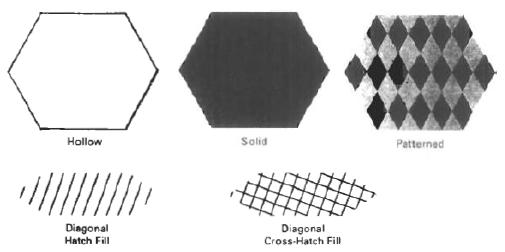
Fill styles:
Areas are displayed with three basic fill styles: hollow with a
colour border, filled with a solid colour, or Wed with a specified pattern or
design.
Fill types image
Fill color:
FillColor is a Color-valued attribute that determines the color used to fill a region with a solid color. Its default value is Color.black.